 |
Os motores de busca de Datasheet de Componentes eletrônicos |
|
|
Os motores de busca de Datasheet de Componentes eletrônicos |
|
The question interval is too short.
Please try again in a few seconds.

Hello, Please ask a question about ADP2441ACPZ-R2 Datasheet
# Example questions:
➢ What is the recommended method for connecting the exposed thermal pad to ensure optimal heat dissipation?
➢ What is the typical operating voltage range for the vcc pin, and what function does it serve?
➢ How does increasing the switching frequency (fsw) generally affect the efficiency of the adp2441, based on the provided efficiency graphs?
| Part No. | ADP2441ACPZ-R2 |
| Manufacturer | AD |
| Size | 1Mb |
| Pages | 32 pages |
| Description | 36 V,1 A, Synchronous, Step-Down DC-to-DC Regulator |

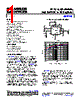
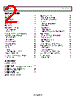
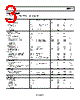
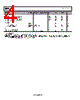
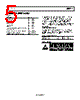
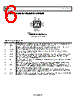
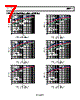
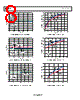
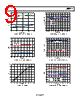

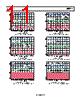
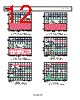
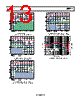

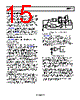
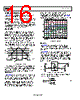


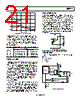
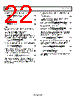





Okay, let's break down the provided text extract from the ADP2441 datasheet. Here's a summary of the key information presented, along with some interpretation to make it more understandable:
1. Overview
️· Document Type: This is an extract from the datasheet for the ADP2441, a switching regulator (likely a buck regulator, based on the contexts). Datasheets are technical documents providing all the specifications and characteristics of a semiconductor device.
️· Purpose: This extract seems to focus on typical performance characteristics, specifically efficiency curves. These curves show how well the regulator converts input voltage to output voltage under different load conditions.
2. Key Parameters & Data Presented
️· Input Voltage (V<sub>IN</sub>): The text shows test data for multiple input voltages: 5V, 12V, 24V, and 6V.
️· Output Voltage (V<sub>OUT</sub>): The data is presented for multiple output voltages: 3.3V and 5V.
️· Switching Frequency (f<sub>SW</sub>): The switching frequency used in the tests are 300 kHz and 700 kHz. This refers to the rate at which the internal switching transistors turn on and off.
️· Load Current (I<sub>LOAD</sub>): The curves are plotted against load current, ranging from 0.01 A to 1 A. This represents the amount of current being drawn from the regulator's output.
️· Efficiency: The primary data shown is efficiency (%), which represents the percentage of input power that is delivered as output power. Higher efficiency means less power is lost as heat.
3. Analysis of the Charts (General Observations based on Titles and Descriptions)
️· Efficiency vs. Load Current: The core of the data. The charts show how efficiency changes as the load current increases. Generally:
- At very light loads (near 0.01A), efficiency can be lower because of losses related to the switching process itself (rather than losses related to the current being supplied).
- Efficiency usually improves as load current increases, reaching a peak at some intermediate load.
- At very high loads, efficiency may start to decrease slightly due to increased power dissipation and losses.
️· Impact of Parameters: By comparing charts with different input voltages, output voltages, and switching frequencies, you can see how these parameters affect efficiency. For example, higher input voltages might improve efficiency under certain conditions, while a different switching frequency could affect performance at different load currents.
4. Interpretation of Chart Designations (Col1, Col2, V = etc.)
️· The `Col1`, `Col2`, and so on, seem to be column headings in a table related to the charts. They likely contain specific configuration parameters used for each test.
️· `V =` indicates a value for voltage, followed by the specific voltage used for the test.
️· "IN" seems to indicate input voltage.
️· "OUT" seems to indicate output voltage.
5. General Impression
The extract is showcasing the ADP2441's performance under various operating conditions. The efficiency curves are a key indicator of its effectiveness as a power supply regulator. A user would likely use these curves to help select the appropriate operating point for the device, balancing efficiency and other factors.
Let me know if you want me to elaborate on a specific part of this extract or if you have more questions!
1. Overview
️· Document Type: This is an extract from the datasheet for the ADP2441, a switching regulator (likely a buck regulator, based on the contexts). Datasheets are technical documents providing all the specifications and characteristics of a semiconductor device.
️· Purpose: This extract seems to focus on typical performance characteristics, specifically efficiency curves. These curves show how well the regulator converts input voltage to output voltage under different load conditions.
2. Key Parameters & Data Presented
️· Input Voltage (V<sub>IN</sub>): The text shows test data for multiple input voltages: 5V, 12V, 24V, and 6V.
️· Output Voltage (V<sub>OUT</sub>): The data is presented for multiple output voltages: 3.3V and 5V.
️· Switching Frequency (f<sub>SW</sub>): The switching frequency used in the tests are 300 kHz and 700 kHz. This refers to the rate at which the internal switching transistors turn on and off.
️· Load Current (I<sub>LOAD</sub>): The curves are plotted against load current, ranging from 0.01 A to 1 A. This represents the amount of current being drawn from the regulator's output.
️· Efficiency: The primary data shown is efficiency (%), which represents the percentage of input power that is delivered as output power. Higher efficiency means less power is lost as heat.
3. Analysis of the Charts (General Observations based on Titles and Descriptions)
️· Efficiency vs. Load Current: The core of the data. The charts show how efficiency changes as the load current increases. Generally:
- At very light loads (near 0.01A), efficiency can be lower because of losses related to the switching process itself (rather than losses related to the current being supplied).
- Efficiency usually improves as load current increases, reaching a peak at some intermediate load.
- At very high loads, efficiency may start to decrease slightly due to increased power dissipation and losses.
️· Impact of Parameters: By comparing charts with different input voltages, output voltages, and switching frequencies, you can see how these parameters affect efficiency. For example, higher input voltages might improve efficiency under certain conditions, while a different switching frequency could affect performance at different load currents.
4. Interpretation of Chart Designations (Col1, Col2, V = etc.)
️· The `Col1`, `Col2`, and so on, seem to be column headings in a table related to the charts. They likely contain specific configuration parameters used for each test.
️· `V =` indicates a value for voltage, followed by the specific voltage used for the test.
️· "IN" seems to indicate input voltage.
️· "OUT" seems to indicate output voltage.
5. General Impression
| Part No. | ADP2441ACPZ-R2 |
| Manufacturer | AD |
| Size | 1Mb |
| Pages | 32 pages |
| Description | 36 V,1 A, Synchronous, Step-Down DC-to-DC Regulator |
| ALLDATASHEET é útil para você? [ DONATE ] |
Sobre Alldatasheet | Publicidade | Contato conosco | Privacy Policy | Link para a ficha técnica | roca de Link | Lista de Fabricantes All Rights Reserved©Alldatasheet.com |
| Russian : Alldatasheetru.com | Korean : Alldatasheet.co.kr | Spanish : Alldatasheet.es | French : Alldatasheet.fr | Italian : Alldatasheetit.com Portuguese : Alldatasheetpt.com | Polish : Alldatasheet.pl | Vietnamese : Alldatasheet.vn Indian : Alldatasheet.in | Mexican : Alldatasheet.com.mx | British : Alldatasheet.co.uk | New Zealand : Alldatasheet.co.nz |
|
Family Site : ic2ic.com |
icmetro.com |
 Portuguese ▼
  English
 Chinese
 German
 Japanese
 Russian
 Korean
 Spanish
 French
 Italian
 Polish
 Vietnamese
 Indian
 Mexican
 British
 New Zealand